財務
Analyze Trading Chart Images
Analyze a submitted market chart image and return a plain-language explanation.
下載工作流程
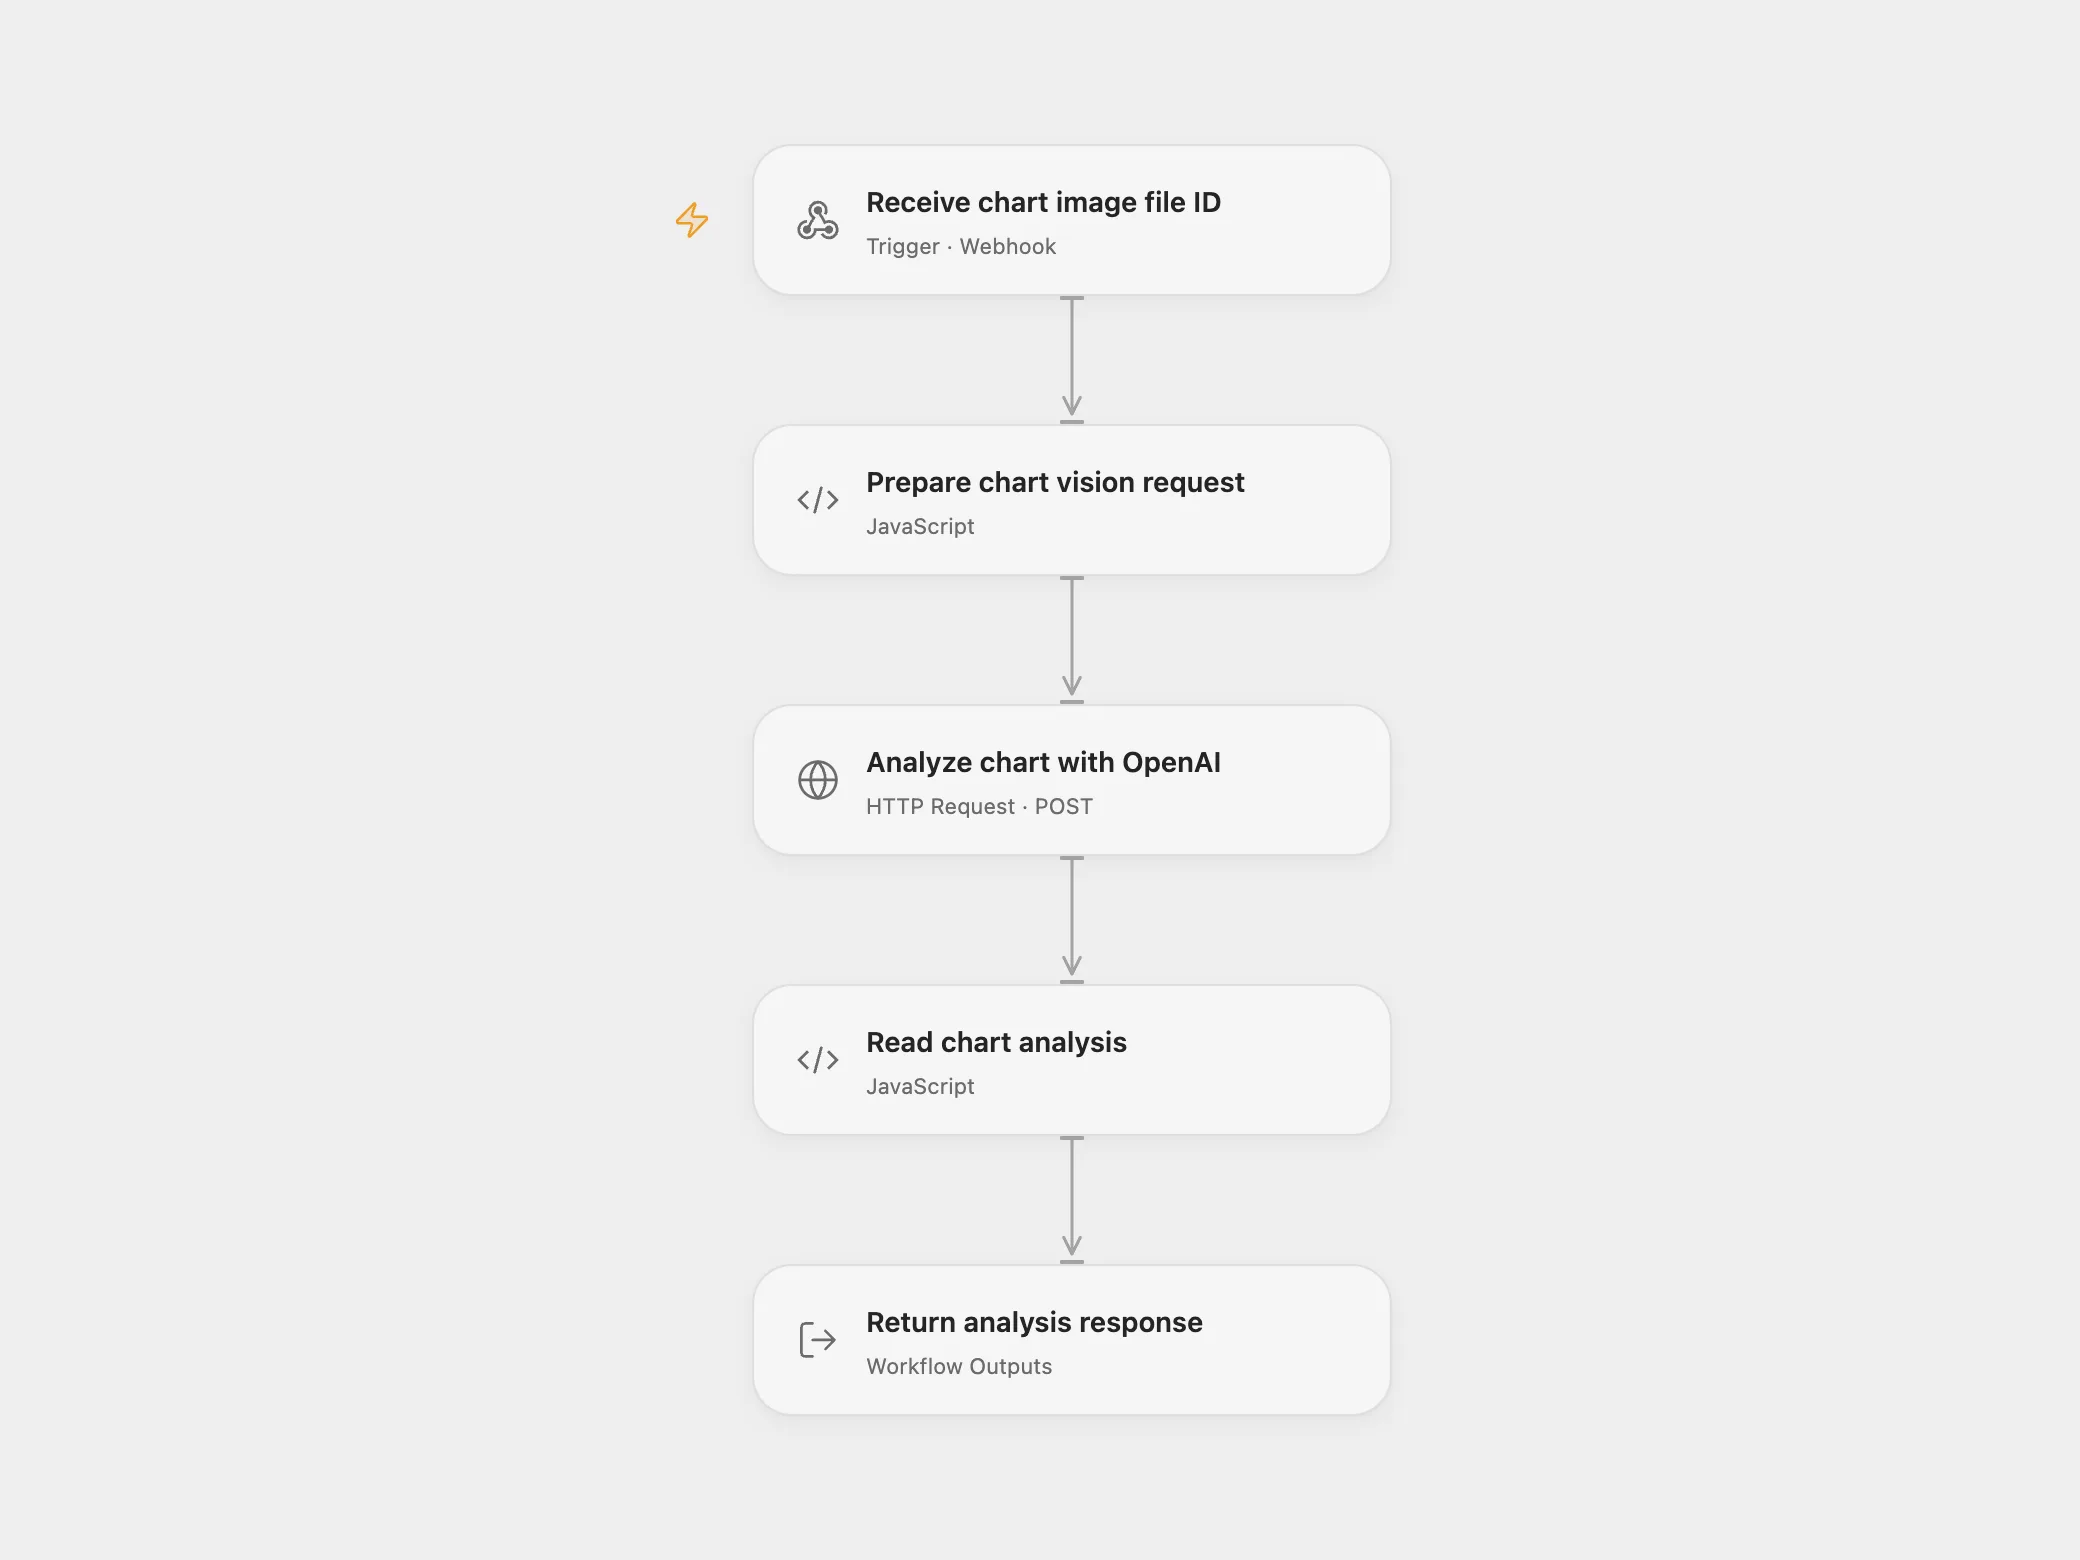
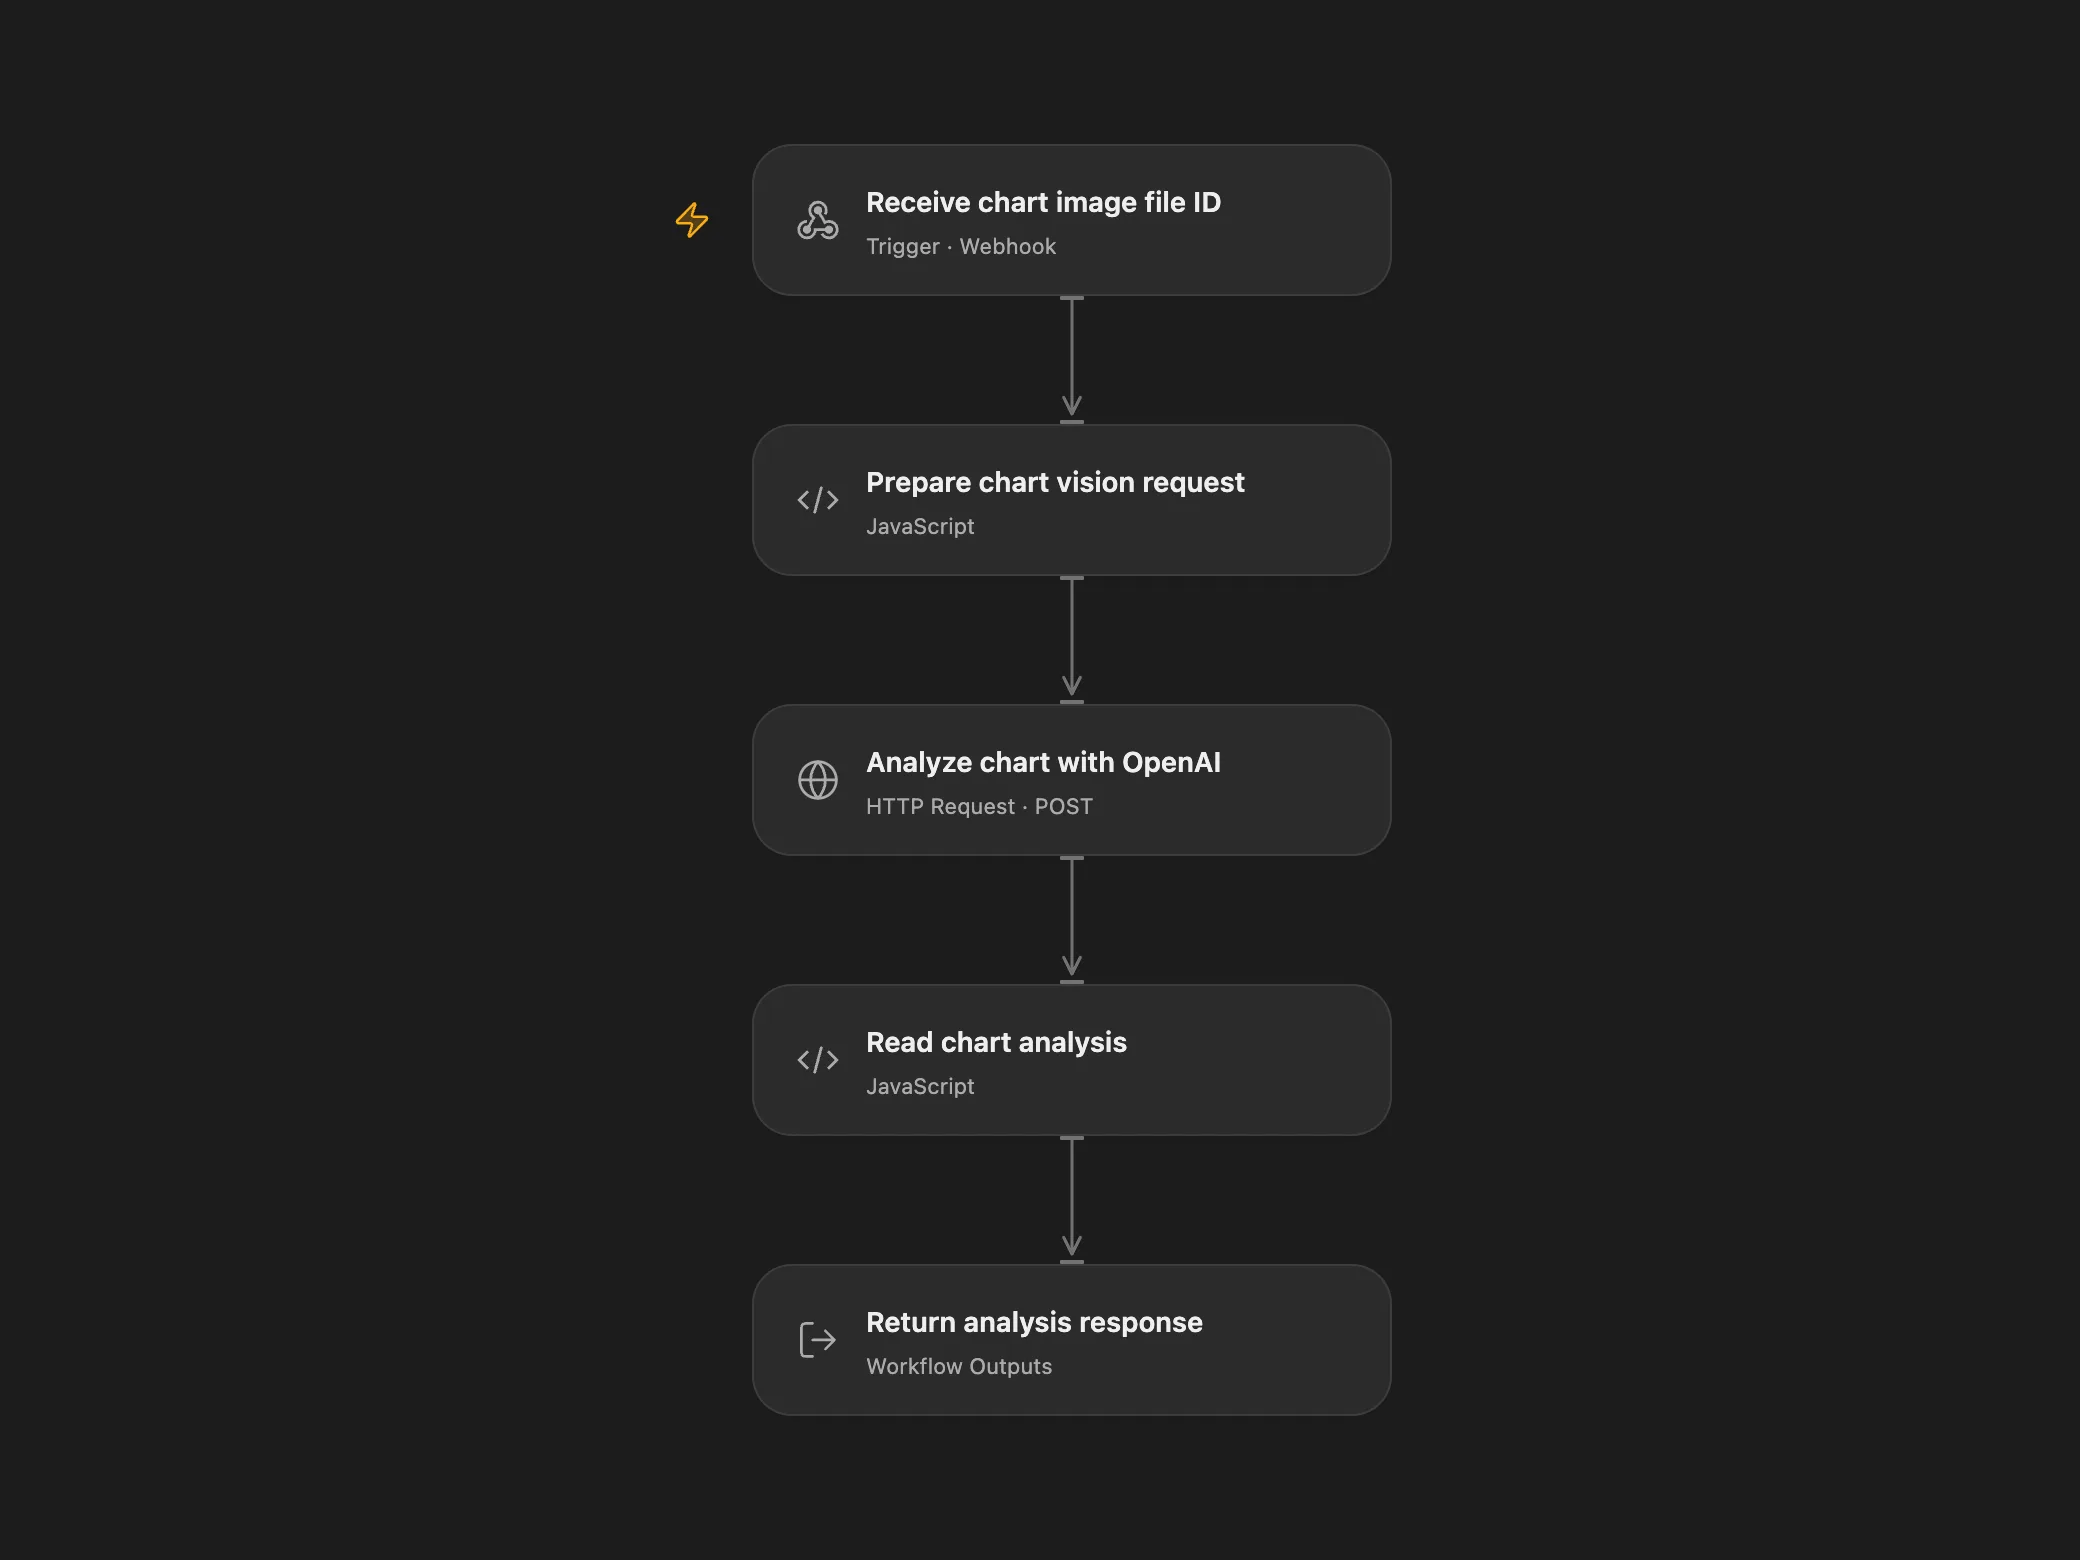
Analyze a submitted market chart image and return a plain-language explanation.
Setup and use
Use one entry point and restrict access. The source does not include the Chrome extension.
POST a chart image as multipart form-data in the data file field, or as a raw image body. For Open Flow mode send a unique X-Request-ID header for each image and reuse it only when checking an uncertain attempt; prevent overlapping requests with the same ID. Uploaded files remain in the OpenAI account according to its retention settings.
Behavior
The model describes a stock or cryptocurrency chart and possible direction in plain language. The image is sent to OpenAI. Analysis can be incorrect or omit important context; it is not binding financial advice. Review it before making trading decisions.
In n8n
Import the n8n workflow, connect OpenAI for direct use, and configure a Header Auth credential on Open Flow chart frontend for Open Flow mode. Deploy the Open Flow webhook, bind OPENAI_API_KEY from the same account as the n8n upload credential, and set the URL in Analyze chart with Open Flow. Configure a Data Table with item_key and status text columns for upload checkpoints. The n8n frontend uploads the image to OpenAI Files with purpose vision, passes its file ID to Open Flow for visual analysis, and returns synchronous text. If upload or analysis completion is uncertain, inspect the account and execution before resolving the pending Data Table row.
Inspiration & credits
Adapted from Analyze tradingview.com charts with Chrome extension, N8N and OpenAI in enescingoz/awesome-n8n-templates.
Source collection notice: © 2024–2026 Enes Cingoz, CC BY 4.0. The source export does not identify a separate template author or license. See repository licensing for the scope of OOMOL contributions and third-party material.